Graph visualization in DOT
Background. We do financial transactions processing. At some point we decided that we need profiling. We could record a path of how a transaction being passed amongst modules. There are two options - either to do static analysis or to trace the runtime.
So, the connections are determined and now we have to formalize and visualize them.
At the first glance this is not an easy task, but it turned out there is a simple and elegant solution.
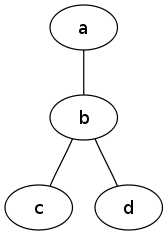
There is a plain text language to declare graphs – DOT. Its beauty is in ultimate simplicity. For example, a trivial graph:
graph name {
  a -- b
  b -- c
  b -- d
}
Feed it to special software and get this:

That’s it! The output is in SVG, ready to stick on a wall.
Unfortunately, the best software I’ve found to visualize DOT is Graphviz. It does pretty decent job properly processing quite sophisticated graphs, but in terms of user experience it’s shite.
If anyone is interested, I’ve shared a real trace (obviously, names are obfuscated). It gives an idea about simplicity of the source and visualization capabilities - PNG and SVG.
Again, the graph formalization is dead simple - you only need to specify pairs of connected vertices. Also, in DOT you can describe directed graphs and extra attributes of the vertices.
To sum up, great technology.
Original post | Disclaimer